Effects of OSHMS Introduction
Primary elements of OSHMS include policy statement by top management, workers' participation, PDCA cycle operation, risk assessment, documentation of procedures, records, etc. Examples of effects expected from these are as follows.
1. Clarification of company-wide policy on safety and health management
Top management such as president, plant directors, or branch office managers express their own “safety and health policies” and make a commitment to efforts in cooperation with workers, whereby “to ensure safety and health” as well as “industrial accident prevention” are clarified as one of the company's management principles. At the same time, the sense of responsibility of top management increases, and with strong leadership prompt and precise deployment of company policies can be expected.
2. Stimulation of health and safety activities through participation by workers
Workers' awareness of industrial accidents is thought to increase by involving workers of the workplace in the system operation such as development/implementation of health and safety objectives or plan, and by designing a structure where their opinions can be reflected. In such an environment, workers will not just follow orders, but become actively involved in daily safety and health activities with an awareness of the issue.
3. Improvement (“spiral-up”) by running the PDCA cycle
As in the case of ISO environment management system, continual/step-by-step improvement (“spiral-up”) of safety and health can be achieved by running the Plan-Do-Check-Act cycle.
If one plans and acts each time without tracking its effects, little progress will be made. Along with setting up quantitative safety and health objectives to make one easily see how much they have archived, appropriate assessment/improvement encourages the health and safety level to rise.
4. Reasonable risk management through risk assessment
The safety and health level will drastically improve by clarifying well in advance any hazard/harm in the workplace, and by prioritizing these risks to reduce or eliminate. Understanding of hazard/harm that is difficult to be aware of on a day-to-day basis, and objective assessment of all the risks help companies to determine appropriate measures to be taken.
5. To systematic operation not relying on individual competence
With the documentation of not only safety and health policies/plans, but also system operation procedures as well as implementation records, the OSHMS becomes clearer to anyone and systematically operates according to the rules. In an environment where operation or organization are rather complicated and experienced veterans retire one after another, by utilizing procedures or records arranged in orderly manner, internal knowledge, know-how, and information will be smoothly passed around in the company, resulting in the improvement of the operation.
Industrial Accidents Decrease after OSHMS Introduction
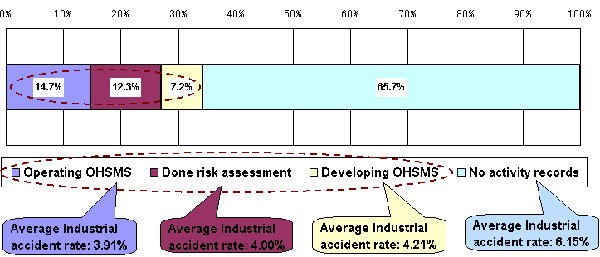
According to the survey conducted in October 2005 by the Ministry of Welfare and Labor, the rate of Japanese workplaces implementing occupational safety and health management systems accounted for 7.3%. In this percentage, 86.7% of workplaces reported that compared to before the introduction of the system, industrial accidents or near miss/close call experience is on the decline.
Rate of workplaces experienced industrial accidents or near miss/close call after the Introduction of OSHMS (%)
| Classification | Ratio of Workplaces with OSHMS | Industrial accident or near miss/close call after OSHMS introduction | |
|---|---|---|---|
| Decreased | Not decreased | ||
| Total | 7.3 | 86.7 | 13.3 |
| @Workplace workers | |||
| 1,000 or more | 37.2 | 61.5 | 38.5 |
| 500 - 999 | 23.3 | 64.6 | 35.4 |
| 300 - 499 | 18.9 | 79.1 | 20.9 |
| 100 - 299 | 12.5 | 69.1 | 30.9 |
| 50 - 99 | 9.9 | 90.0 | 10.0 |
| 30 - 49 | 6.9 | 89.7 | 10.3 |
| 10 - 29 | 6.4 | 88.9 | 11.1 |
| @industry | |||
| Construction | 19.1 | 77.5 | 22.5 |
| Manufacturing | 6.0 | 88.1 | 11.9 |
| Electricity/gas/power /water supply | 35.4 | 77.1 | 22.9 |
| Information and telecommunication | 4.1 | 63.4 | 36.6 |
| Traffic | 9.8 | 79.8 | 20.2 |
| Wholesale/retail sale | 4.3 | 99.1 | 0.9 |
| Hotels and restaurants | 3.6 | 96.1 | 3.9 |
| Services | 6.6 | 94.1 | 5.9 |

